|
Efficient lighting for high-speed imaging on vehicle safety test applications
Burkhard Severon
Part 1 Light and Radiation Sources
For the quantity and quality of data recorded by the use of High-Speed-Photography and Videography, light plays an important
role.
Beside the basic requirements concerning illuminance, spatial uniformity and light modulation, the efficiency in respect to the sensitivity of the high-speed imaging sensor needs to be
considered.
On this subject the paper will focus on the effective illumination for the latest technology of high-speed video systems.
1. Effective and balanced illumination for ccd-sensors
 The use of high speed photography and videography
achieves an essential contribution for the collection of relevant data at automotive safety testing. Today especially the high-speed video systems are gaining on importance. The use of high speed photography and videography
achieves an essential contribution for the collection of relevant data at automotive safety testing. Today especially the high-speed video systems are gaining on importance.
Figure 1 shows a typical test configuration for this application.
To receive and process the test data by capturing images requires an adequate illumination or better irradiation. The
general term for this need is ”Light”. The following expositions may clarify that light is not necessarily all what is needed to make a high ratio of data available for
the receiving sensors.
For this a detailed characterization of the radiation sources and the technical detectors must be undertaken.
1.1 Definition of Light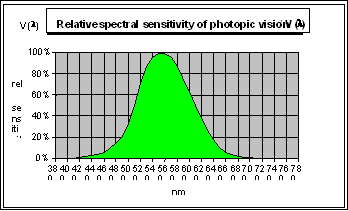
If we talk about light and related terms
like, luminous flux (Lumen [lm]), luminous efficacy (Lumen per watt [lm/W]), luminous intensity (Candela [cd] or illuminance (Lux [lx]), it is important to understand how these values are
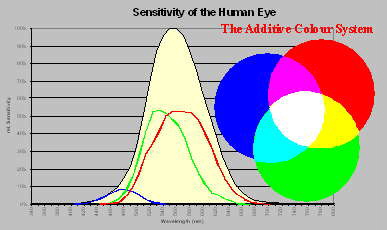
measured. The illuminance given in Lux is the most common value to define "light" intensity requirements and specifications. Devices to measure illuminance have a spectral sensitivity
that is well adjusted to the spectral sensitivity of the human eye, V (l), as shown at figure 2.
 So only the irradiance being effective to the human eye is called and measured as illuminance. So only the irradiance being effective to the human eye is called and measured as illuminance.
If radiation sources are judged
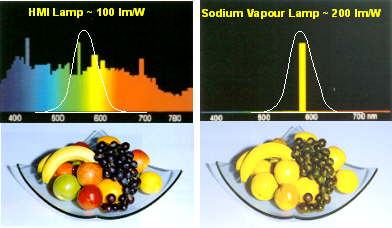
by there luminous efficacy, they are not necessarily an efficient source in respect to the technical sensors used for photography and videography. Figure 3 shows an extreme example on this matter.
The Sodium vapor lamp on the right, found as a common light source for street lighting, has an extreme high luminous efficacy of about 200 lm/W. The reason for this is given by the sources spectral
power distribution in relation to the V(l) sensitivity. A "full" spectrum source, like the HMI lamp on the
left, still offers high luminous efficacy, but about only half compared to the Sodium vapor lamp.
 Looking to the results given by the two images below the curve of each lamp, proofs how much information could get lost if ones concentrate just on luminous
efficacy. Even transferred to a gray scale the images clearly show the effect. Looking to the results given by the two images below the curve of each lamp, proofs how much information could get lost if ones concentrate just on luminous
efficacy. Even transferred to a gray scale the images clearly show the effect.
The reason for this is found taken again a closer look to the "light" sensor, the human eye at figure 4.
Here we found that the total sensitivity is splitted into three (3) sensitivity ranges, the blue, green and red shown from left to right. The additive colour system than enables our colour vision.
An unbalanced irradiation as shown by the example above will therefore lead to divergences or even losses on colour information. Same is true if one of the three ranges is not correctly developed.
1.2 Technical Sensors
Technical sensors, which need to be discussed when searching for effective and balanced i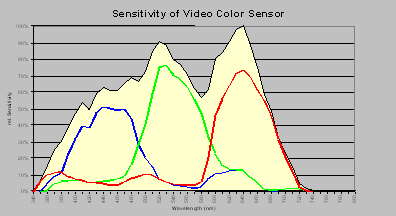 rradiation on high-speed imaging
applications, are likewise characterized by their spectral sensitivity. Gaining more and more importance we take a look to the CCD-Sensor of a high-speed video system (Fig. 5) rradiation on high-speed imaging
applications, are likewise characterized by their spectral sensitivity. Gaining more and more importance we take a look to the CCD-Sensor of a high-speed video system (Fig. 5)
Same as for the human eye we find three independent ranges of sensitivity. The blue, the green and the red channel are forming the total sensitivity s (l), which is given by Sblue (l) + Sgreen (l)
+ Sred (l ). To define now the total effective irradiance for the CCD-Sensor, which is:
a look to the spectral power distribution of various radiation sources needs to be taken.
1.3 Radiation Sources
Radiation sources are technical described by the following values:
Radiant Flux Q/t, measured in W. It indicates which radiation energy per unit of time is leaving the radiation source.
Irradiance E, measured in W/m². It indicates which radiant flux is impinges an area F.
Spectral irradiance , measured in W/m² / nm. It indicates the amount of irradiance at an area F in the
wavelength range Dl, which is usually 1 nm. Most important to evaluate the efficiency is the knowledge of the spectral distribution.
As representatives of radiation sources that found frequent use for the application of high-speed
imaging, Daylight (global solar radiation), Tungsten Halogen, Xenon and special Metal Halide lamps had been selected for evaluation.
Figure 6 shows the spectral distribution of those sources when standardized to the same irradiance (280–3.000nm).
1.4 Effective Irradiance
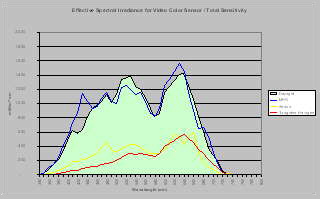
Figure 7 shows the effective spectral irradiance and
figure 8 the total effective irradiance for the CCD-Sensor given by the four different radiation sources. It
shows that for "Daylight" and the MHG lamps the effective irradiance is about 4 times higher than for Xenon or Tungsten Halogen.
1.5 Effective and Balanced Irradiance
 As discussed under 1.1
and 1.2 the spectral balance of the radiation is even more important than the total effective irradiance in respect of colour imaging. As discussed under 1.1
and 1.2 the spectral balance of the radiation is even more important than the total effective irradiance in respect of colour imaging.
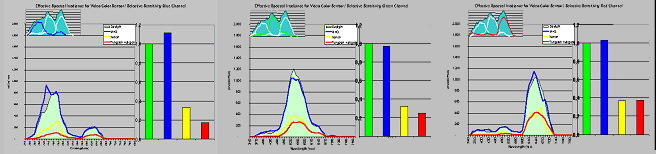
Figure 9 shows again the spectral power distribution
of the four selected radiation sources, but narrowed to the spectral range of importance, from 340 to 800nm.
The standardization to the same total irradiance had been kept for this graph.
Different from the first approach the calculation on effective irradiance had been made now more selective for the three (3) colour channels (blue-green-red).
The individual results for each channel are shown on figure 10.
Using this information a comparison of the effective and balanced irradiance could be made.
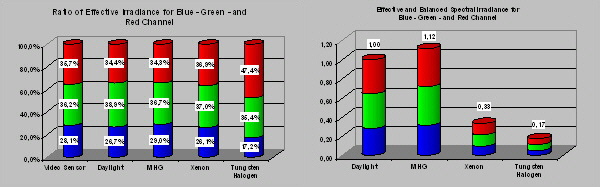
Figure 11 first shows the summary for blue, green and red channel (from top to bottom). At figure 12 the ratio of total (100%) sensitivity for the three (3) channels is visualized.
The ratio of effective irradiance is than given in relation to the ratio of the video sensor at Figure 13,
showing the increasing red and decreasing blue ratio for the Xenon and especially for the Tungsten Haloge
Using the calculation on the effective irradiance for the three (3) channels as shown in figure 11 and
recalculate the results to achieve a effective irradiance balanced to the ratio of the CCD sensor, will
finally give the effective and balanced irradiance offered by the different radiation sources (Fig. 14).
So only radiation sources offering a close match to the spectral sensitivity of the sensors will enable the highest collection of test data at high-speed imaging processes. |